My tests are my safety net. With them I can refactor with confidence, knowing that I’m keeping the functionality I intended. With them, I can grow my codebase, knowing that I’m not introducing regression errors. How do I have confidence that my safety net is good enough? One metric I can use to help with this is code coverage. It answers the question “When I run my tests, how much of my application code executed?”. It’s a somewhat crude metric—telling me how broad the net is not how strong—but it’s a good place to start. Fortunately, setting it up on a rails project is pretty simple.

See how happy people are when they have a safety net?
Getting Started
I’ve made a simple example app that shows code coverage in action. Check out the source code from the code_coverage branch of my spex repository:
git clone -b code_coverage --single-branch https://github.com/eyefodder/spex.git
Now go to the ops directory and run vagrant up To get the virtual machine running. Next, let’s hop into the virtual machine and run the test suite:
vagrant ssh
...some output...
vagrant@spex:~$ cd /app
vagrant@spex:~$ rspec
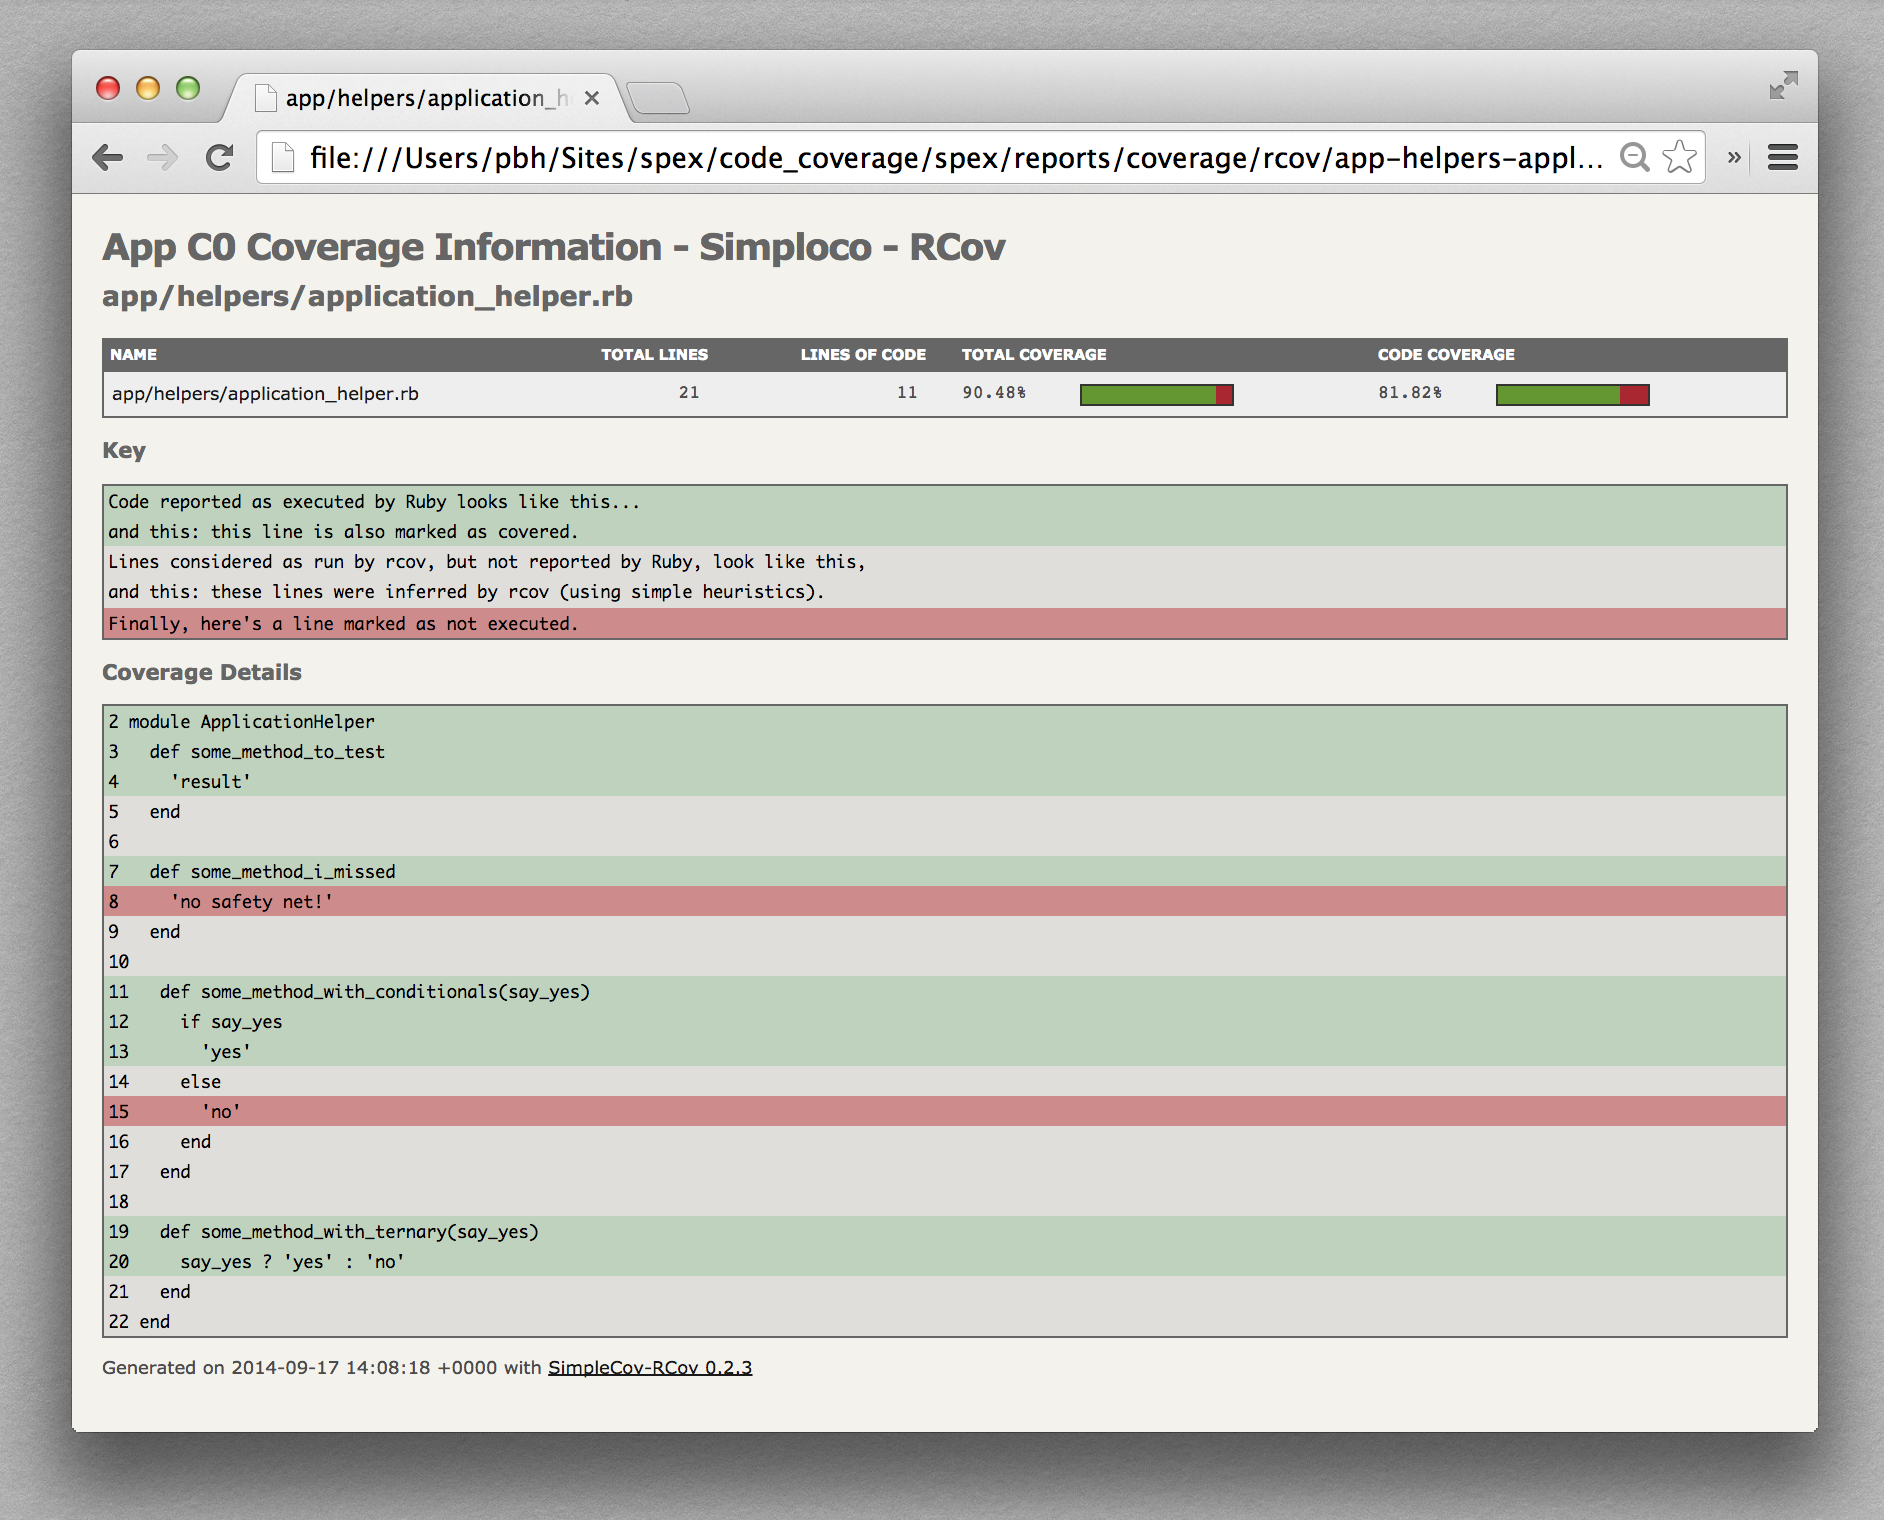
Now, check out the reports folder. You’ll see that there is a coverage/rcov folder. Open the index file in the browser and you see an easy to digest code coverage report:

Pretty nifty huh? You can click on the rows in the table to see each class in more detail, and find out exactly which lines aren’t being executed:
Let’s take a look at how this was all set up…
Code Coverage Gems
First up, we need to add a couple of gems to the Gemfile:
  # code_coverage
  gem 'simplecov', :require => false
  gem 'simplecov-rcov', :require => false
Once we’ve run a bundle install, our next step is to configure our test suite to generate coverage reports.
Configuring Code Coverage
This, again is a pretty simple affair. We need to launch SimpleCov before any application code has run, so we have this code at the top of the spec/spec_helper.rb
if ENV['GENERATE_COVERAGE_REPORTS'] == 'true'
  require 'simplecov'
  require 'simplecov-rcov'
  SimpleCov.start 'rails' do
    coverage_dir ENV['CI_COVERAGE_REPORTS']
  end
  SimpleCov.formatter = SimpleCov::Formatter::RcovFormatter
end
There’s a few things happening here. We have a couple of environment variables that tell us if we should create reports: GENERATE_COVERAGE_REPORTS and if we do, where we should put them: CI_COVERAGE_REPORTS. If you’ve followed my earlier post on getting Guard to send Growl notifications, you will know to find these in ops/dotfiles/guest_bash_profile which is a profile automatically generated when we launch the virtual machine with vagrant up. If not, well, now you do!
The next thing you’ll notice is the SimpleCov.start 'rails' call on line 4. This configures SimpleCov to have a profile that is good for most Rails applications. For example, the spec and config folders are excluded from coverage stats. You can read more about profiles here.
Finally, we tell SimpleCov that we want to format our results with the SimpleCov::Formatter::RcovFormatter. When we get to running our build as part of a continuous integration process with Jenkins, we can use this format to parse results to be viewed in the dashboard.
Viewing Code Coverage Reports generated on a Guest VM
The last thing we have to deal with is the fact that the reports are generated on the guest virtual machine. In our existing setup, we use rsync to push code changes from the host to the virtual machine. But this only works one way, and if we add content within the virtual machine you won’t see them on the host. We solve this with these lines in the Vagrantfile
  config.vm.synced_folder '../reports', '/reports'
  config.vm.synced_folder "../", "/app", type: "rsync", rsync__exclude: [".git/", "ops/*", "reports/", "tmp/", "log/", ".#*"]
What this does is exclude the reports from the main rsync and instead setup a new (regular) shared folder that will map reports to /reports on the virtual machine (note this is a root level folder, not in the /app folder on the guest. This is why we have used an environment variable to tell SimpleCov where to output reports.
Beware the emperor’s new code coverage
.png)
One thing to bear in mind is that code coverage really is a very crude metric. There are different types of coverage metrics, and SimpleCov only provides ‘C0′ coverage: lines of code that executed. Other types include branch and path coverage, but as far as I know, there aren’t any tools for these in Ruby. Let me show you an example of where this falls down:
If you look at this report, we can see that the some_method_with_conditionals gets called, but only the say_yes path (lines 12 and 13) executes, and we never confirm that ‘no’ gets sent if we pass false to the method. So far, so good, until we look at some_method_with_ternary. This is basically the same method refactored to be more compact, and with the same tests run against it. Yet we are told it is totally covered. So is the metric even still useful?
I still think code coverage is a valuable metric, if only to show you where there are holes in your test suite. If you go in with this knowledge and understanding the limitations, then you will be better equipped to maintain the quality of your app over time.
Code Coverage is a temporal metric
The last thing I want to mention about code coverage is that it’s useful to understand how your coverage changes over time. Particularly if you are managing a team of developers, it provides a quick warning if developers are slipping on their test writing. If you have a Continuous Integration machine, you can track these sort of metrics over time, which can really help you get a sense of where things are headed.
In my next post I’ll show how to set up your very own CI machine with just a few clicks…